Getting Started with the SEC XBRL Pipeline
This guide shows you how to load SEC financial data locally and query it using the RoboSystems platform.
Quick Start: Run just demo-sec to automatically set up everything and see your data in action within minutes!
Overview
The SEC local pipeline allows you to:
- Load company financial filings (10-K, 10-Q) by ticker symbol
- Or pull the entire prebuilt corpus from Hugging Face with
just sec-dump - Store XBRL data in a local Ladybug graph database
- Query financial data using Cypher or the MCP client
- Inspect staged data in DuckDB before ingestion
- Query SEC filings using natural language through any MCP-compatible AI tool
Prerequisites
Before starting, ensure you have:
- Docker running locally
- RoboSystems development environment set up
- Services started with
just start
Quick Start
One-Command Setup
The fastest way to get started is with the demo-sec command, which handles everything automatically:
# Load NVIDIA 2025 data with automatic setup and example queries (defaults)
just demo-sec

# Load specific company and year
just demo-sec --ticker AAPL --year 2024

# Skip running example queries after setup
just demo-sec --ticker TSLA --year 2023 --skip-queries
What happens automatically:
- User Setup - Creates demo user with credentials (or reuses existing)
- Download - Fetches XBRL files from SEC EDGAR
- Process - XBRL processors transform data to structured format
- Generate - Creates Parquet files optimized for graph ingestion
- Stage - Uploads to S3 and creates DuckDB staging tables
- Validate - Automatic data quality checks and deduplication
- Ingest - Direct DuckDB → Ladybug via database extension
- Subscription - Subscribes your user to the SEC shared repository (plan
starterby default) - Config Update - Updates credentials with SEC graph info
- Example Queries - Runs preset queries showing your data (unless skipped)
SEC access is a subscription, not a one-off grant — the shared repository is billed like any other plan. If you only want the subscription and no data:
# Subscribe only; skip the download/process/ingest pipeline entirely
just demo-sec --subscribe-only

# Or use the dedicated recipe. sec-advanced raises rate limits and credits.
just demo-sec-subscribe                 # sec-starter (default)
just demo-sec-subscribe sec-advanced

# Pick the plan on a full run
just demo-sec --plan sec-advanced
Note: Setup and loading takes 1-5 minutes depending on the number of years of data.
Your credentials are saved to .local/config.json with your API key and user information.
The full corpus, prebuilt: just sec-dump
just demo-sec builds a graph for one ticker and year from EDGAR. If you want the entire corpus — every XBRL filing since January 2024, ~8,400 filers and 77 million facts — the same file that backs the hosted sec graph is published monthly as one LadybugDB file on Hugging Face: robosystems/sec-xbrl-knowledge-graphs.
just sec-dump                # ~35 GiB download → data/lbug-dbs/sec.lbug (~128 GiB); restarts graph-api if it is running
just sec-dump --force        # replace an existing sec.lbug (for example one built by demo-sec)
just sec-dump-no-restart     # same, without the graph-api restart
It downloads sec.lbug.zst (resumable), verifies the archive's checksum and recorded size while decompressing, lands sec.lbug in the directory the stack mounts, removes a stale .wal, deletes the archive, and warns if the engine that wrote the dump differs from the ladybug version this checkout pins. Budget ~165 GiB free during decompression, and real time — it is 128 GiB on disk.
Then subscribe and query exactly as elsewhere in this guide — just demo-sec-subscribe grants access without loading anything — or read the file directly, no services needed:
just lbug-query sec "MATCH (e:Entity) RETURN count(e)"
The file opens with the LadybugDB release that wrote it — the ladybug== version this repo pinned in pyproject.toml when the snapshot was built (0.18.1 today). The dataset card states it (the Engine row and its Engine version section), each snapshot's commit title carries it, and just sec-dump warns when your checkout pins something else. The card also carries the snapshot date, sizes, and further example queries.
Advanced: Manual Loading
For more control over the loading process, you can use individual commands:
# Load additional companies after initial setup
just sec-load AMD 2025
just sec-load INTC 2024

# Check database health
just sec-health

# Detailed health check with statistics
just sec-health v
The health check shows:
- Database connectivity status
- Number of entities (companies) loaded
- Number of reports (filings) available
- Number of facts (financial metrics)
- Data coverage by year
Behind the Scenes
The SEC pipeline uses a staging-first architecture. Data goes through DuckDB staging tables before reaching the graph database. This enables validation, transformation, and quality checks before final ingestion.
Explore Preset Queries
The demo command automatically runs 25 preset queries showing your data — 15 graph queries plus 10 document searches. To explore the data interactively or re-run all queries:
# Interactive mode (enter queries directly, list presets, run specific ones)
just demo-sec-query

# List every preset without running anything
just demo-sec-query --list
In interactive mode (the prompt is sec>), you can:
- Type
presetsto list all available queries, graph and search - Type
preset <name>to run a specific query (e.g.,preset entities) - Type
search <query>for a full-text search across filings - Type
search <query> @NVDAto scope that search to one entity - Enter custom Cypher queries directly
- Type
helpfor available commands - Type
quitto exit
Graph Query Presets (Cypher):
summary- Node and relationship countsentities- Public companies with basic inforecent_reports- Most recent SEC filingsreport_types- Report form type countsfinancial_facts- Sample financial factsfact_dimensions- Dimensional qualifiers on factsfact_periods- Facts by time periodselements- Most commonly used XBRL elementsreport_structure- Fact counts per reportentity_overview- Entities with report countsfact_aspects- Facts with all aspects (Element, Period, Unit)fact_with_dimensions- Facts with dimensional contexttaxonomy_structures- Report taxonomy structureselement_hierarchy- Element parent-child relationshipsreport_taxonomy_detail- Complete report taxonomy structure
Document Search Presets (OpenSearch):
risk_factors- Risk factor disclosures across all entitiesai_strategy- Mentions of AI and machine learning strategyrevenue_recognition- Revenue recognition policy disclosurescybersecurity- Cybersecurity risk and incident disclosuresgoodwill_impairment- Goodwill and impairment discussionssegment_reporting- Operating segment descriptions and breakdownsmda_overview- Management discussion and analysis highlights (10-K Item 7)mda_quarterly- Quarterly MD&A highlights (10-Q Item 2)supply_chain- Supply chain and sourcing disclosurestariff_trade- Tariff, trade policy, and geopolitical risk mentions (10-K)
Authentication Setup
The just demo-sec command automatically creates user credentials for you. Your API key is saved in .local/config.json.
Important: The API key (starting with rfs) is your authentication credential, not to be confused with the JWT Token and Authorization Header.
Additional Users (Optional):
If you need to create additional users with SEC repository access:
# Create test user with SEC repository access
just demo-user --repositories sec
Accessing the Data
You have multiple options for accessing and querying the loaded SEC data:
- MCP Client - AI agent integration through Claude Desktop
- Direct Cypher Queries - Command-line Cypher queries via
just graph-query - Query Staging Tables - SQL queries on DuckDB staging via
just tables-query - Python API - Programmatic access via RoboSystems Python client
- G.V() Visual Explorer - Interactive graph visualization (recommended tool)
- SQL IDE Tools - Direct database access with DuckDB-compatible IDEs
Option 1: MCP Client (For AI Agents)
Access data through any MCP-compatible AI tool (Claude Desktop, Claude Code, Cursor, Cline, etc.) using the MCP protocol.
Setup MCP Client:
-
Run
just demo-secto create credentials automatically (your API key is saved to.local/config.json) -
Get your API key from the credentials file:
cat .local/config.json | grep api_key
- Connect your client. Every graph serves the MCP Streamable HTTP transport directly — one URL plus one header. For Claude Code:
claude mcp add --transport http robosystems-sec \
  http://localhost:8000/v1/graphs/sec/mcp \
  --header "X-API-Key: <your key>"
For Cursor / VS Code (mcp.json):
"robosystems-sec": {
  "url": "http://localhost:8000/v1/graphs/sec/mcp",
  "headers": { "X-API-Key": "<your key>" }
}
Against production the same URL shape is https://api.robosystems.ai/v1/graphs/sec/mcp. Clients without HTTP transport support can use the legacy stdio bridge.
Clients with no field for a custom header — claude.ai and Claude Desktop custom connectors among them — sign in instead: add https://api.robosystems.ai/v1/mcp, and choose the graph on the consent screen. The ?token= carriage that once allowed a key in the URL was retired when OAuth landed, and a credential in the query string is now rejected. See AI Operators & MCP.
-
Restart your MCP-compatible AI tool
-
The MCP server provides these tools:
Curated Tools (no Cypher needed):
financial-statement-analysis- Structured financial statement by ticker and type (income_statement,balance_sheet,cash_flow_statement,equity_statement)build-fact-grid- Pivot facts across entities, periods, and dimensions — the multidimensional view over the XBRL hypercuberesolve-element- Look up XBRL element details by name or canonical concept (uses vector search when available)disclosures- The map of a filing's sections, one row per note or statementinformation-block- One section read whole: its rows, breakdowns, footing checks and text
GraphQL reads are not part of this surface: the typed GraphQL tools serve a tenant graph's operational data, and a shared repository has none.
Graph Tools (general purpose):
read-graph-cypher- Run Cypher queries directlyget-graph-schema- View available node and relationship typesget-graph-info- Inspect graph topology and node/relationship countsget-example-queries- Get sample queries for common patternslist-subgraphs- Enumerate this repository's subgraphs and their connector URLs
Search Tools (gated by
SEMANTIC_SEARCH_ENABLED, which defaults to on):search-documents- Full-text search across filing narratives, MD&A, risk factors, and iXBRL disclosuresget-document-section- Retrieve full text of a document found via search
Example MCP Usage:
You: What revenue did NVIDIA report in 2024?

The AI will use:
1. financial-statement-analysis with ticker=NVDA, statement_type=income_statement
   → Returns structured revenue, expenses, net income with periods
Option 2: Direct Cypher Queries (For Development)
Query the database directly using Cypher (no authentication required for local queries):
# List all companies in the database
just graph-query sec "MATCH (e:Entity) RETURN e.name, e.identifier LIMIT 10"

# Get reports for a specific company
just graph-query sec "MATCH (e:Entity)-[:ENTITY_HAS_REPORT]->(r:Report) WHERE e.name CONTAINS 'NVIDIA' RETURN r.form, r.filing_date LIMIT 10"

# Find revenue facts
just graph-query sec "MATCH (f:Fact)-[:FACT_HAS_ELEMENT]->(el:Element) WHERE el.name = 'NetIncomeLoss' RETURN el.name, f.numeric_value, f.value LIMIT 10"
Common Cypher Patterns:
-- Find all facts for a NVDA SEC CIK
MATCH (e:Entity)-[:ENTITY_HAS_REPORT]->(r:Report)-[:REPORT_HAS_FACT]->(f:Fact)
WHERE e.cik = '0001045810'
RETURN f

-- Get balance sheet items
MATCH (f:Fact)-[:FACT_HAS_ELEMENT]->(el:Element)
WHERE el.name STARTS WITH 'Assets'
RETURN el.name, f.numeric_value

-- Find facts by period
MATCH (f:Fact)-[:FACT_HAS_PERIOD]->(p:Period)
WHERE p.instant_date = '2024-01-28'
RETURN f
Option 3: Query Staging Tables (For Data Validation)
Query the DuckDB staging tables to inspect data before it reaches the graph:
# List all entities in staging
just tables-query sec "SELECT * FROM Entity LIMIT 10"

# Count facts by element
just tables-query sec "SELECT el.name, COUNT(*) as fact_count FROM Fact f JOIN FACT_HAS_ELEMENT fhe ON f.identifier = fhe.src JOIN Element el ON fhe.dst = el.identifier GROUP BY el.name ORDER BY fact_count DESC LIMIT 20"

# Check data quality - find null values
just tables-query sec "SELECT COUNT(*) as null_count FROM Entity WHERE name IS NULL"

# Explore specific company's reports
just tables-query sec "SELECT r.* FROM Report r JOIN ENTITY_HAS_REPORT ehr ON r.identifier = ehr.dst JOIN Entity e ON ehr.src = e.identifier WHERE e.name LIKE '%NVIDIA%'"

# Check available time periods
just tables-query sec "SELECT DISTINCT instant_date FROM Period ORDER BY instant_date DESC LIMIT 10"

# Find revenue facts with full details
just tables-query sec "SELECT f.value, f.numeric_value, p.instant_date, u.measure FROM Fact f JOIN FACT_HAS_ELEMENT fhe ON f.identifier = fhe.src JOIN Element el ON fhe.dst = el.identifier JOIN FACT_HAS_PERIOD fhp ON f.identifier = fhp.src JOIN Period p ON fhp.dst = p.identifier JOIN FACT_HAS_UNIT fhu ON f.identifier = fhu.src JOIN Unit u ON fhu.dst = u.identifier WHERE el.name = 'Revenues' LIMIT 10"
Why Query Staging Tables?
- Pre-ingestion validation: Check data quality before it enters the graph
- SQL familiarity: Use SQL joins and aggregations you already know
- Performance: DuckDB's columnar storage is extremely fast for analytics
- Debugging: Identify issues in source data before graph ingestion
Available Staging Tables:
Entity- Companies with SEC CIK identifiersReport- 10-K and 10-Q filingsFact- Financial metrics with valuesElement- us-gaap metric definitions (withcanonical_conceptfrom enrichment)Period- Date/duration contextsUnit- Measurement units (USD, shares, etc.)Dimension- Segments and breakdownsStructure- XBRL presentation/calculation networks (withcanonical_type)Association- Parent-child element relationships within structuresClassification- Disclosure type tags on associations (e.g., AssetsRollUp, IncomeStatement)FactSet- Logical groupings of facts by structure and statement typeLabel- Human-readable labels for XBRL elementsReference- Authoritative references (FASB codification links)Taxonomy- Global XBRL taxonomy definitions
Option 4: Python API (For Applications)
Access via the RoboSystems Python client:
from robosystems_client import RoboSystemsClient
from robosystems_client.api.query.execute_cypher import sync_detailed as execute_query
from robosystems_client.models.cypher_statement_request import CypherStatementRequest
import json
from pathlib import Path

# Load API key from credentials file (created by just demo-sec)
credentials_path = Path(".local/config.json")
with open(credentials_path) as f:
    credentials = json.load(f)

# Initialize client with API key
client = RoboSystemsClient(
    base_url="http://localhost:8000",
    token=credentials["api_key"],
    auth_header_name="X-API-Key",
    prefix="",
)

# Run Cypher query
request = CypherStatementRequest(
    query="""
    MATCH (e:Entity)-[:ENTITY_HAS_REPORT]->(r:Report)-[:REPORT_HAS_FACT]->(f:Fact)
    WHERE e.name CONTAINS 'NVIDIA'
    RETURN e.name, r.form, f.numeric_value
    LIMIT 10
    """,
    parameters={},
)

response = execute_query(graph_id="sec", client=client, body=request)

# `parsed` is the decoded JSON body — a dict, not a typed model.
# Keys: success, data, columns, row_count, execution_time_ms, graph_id, timestamp, error
if response.parsed:
    print(f"Results: {response.parsed['data']}")
CypherStatementRequest also takes an optional timeout (seconds, 1–300, default 60).
Option 5: G.V() Graph IDE For Interactive Exploration
G.V() is a powerful graph visualization tool and our recommended partner for visualizing Ladybug databases:
Why G.V() for Ladybug?
- Native Ladybug database support
- Interactive graph exploration
- Real-time Cypher query visualization
- Perfect for understanding complex financial relationships
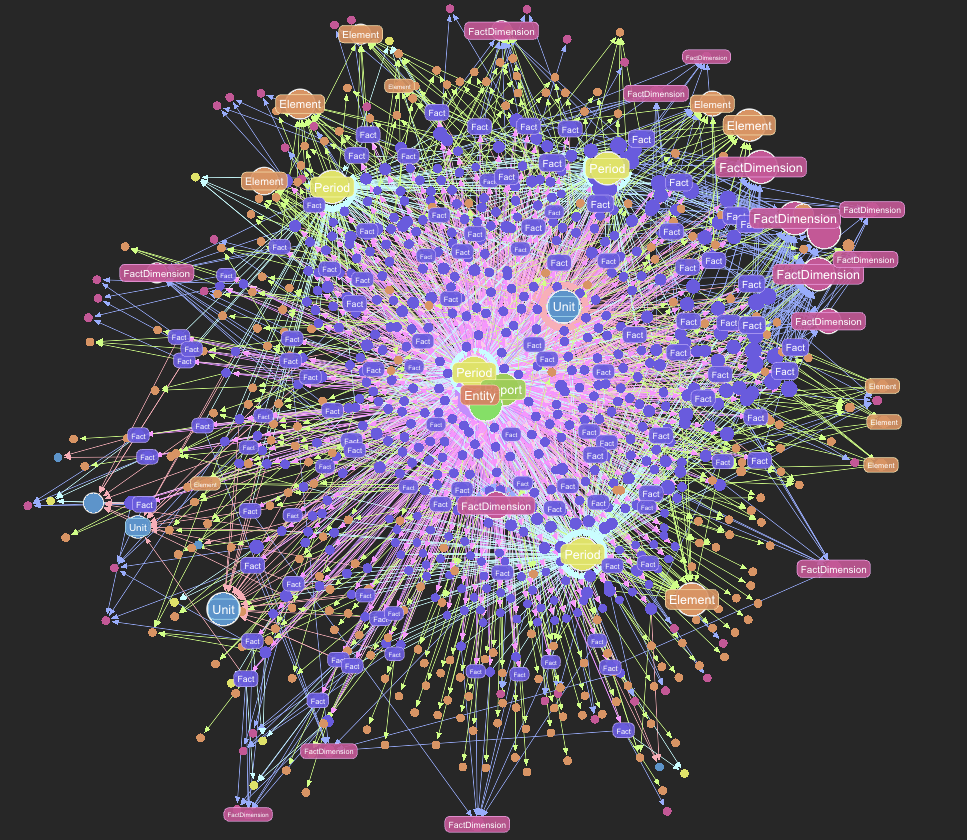
Example: Financial report graph visualized in G.V() showing entities, reports, facts, and their relationships
Getting Started with G.V():
- Visit https://gdotv.com/ or download the desktop application
- Open the application
- Connect to your local Ladybug database:
- Database Path:
./data/lbug-dbs/sec.lbug(from RoboSystems root directory)
- Database Path:
- Enable "Fetch all edges between vertices" in settings for richer visualizations
- Run Cypher queries and visualize results interactively
What you can do:
- Visualize graph relationships interactively
- Explore entity connections visually
- Debug complex graph patterns
- Understand data model structure
- Click nodes to see properties and relationships
- Export visualizations for presentations
Example visualization queries:
-- Visualize a company and its reports
MATCH (e:Entity {name: 'NVIDIA CORP'})-[:ENTITY_HAS_REPORT]->(r:Report)
RETURN e, r
LIMIT 5

-- See fact relationships
MATCH (r:Report)-[:REPORT_HAS_FACT]->(f:Fact)-[:FACT_HAS_ELEMENT]->(el:Element)
WHERE r.form = '10-K'
RETURN r, f, el
LIMIT 20

-- Explore full entity context
MATCH (e:Entity)-[:ENTITY_HAS_REPORT]->(r:Report)-[:REPORT_HAS_FACT]->(f:Fact)
WHERE e.cik = '0001045810'
RETURN e, r, f
LIMIT 10
Visualization Tips:
- Start with small LIMIT values (5-20 nodes) to avoid cluttering
- Use WHERE clauses to filter to specific companies or time periods
- Click nodes to see properties
- Use the layout options to organize the graph
Option 6: SQL IDE Tools (For Staging Data Validation)
You can open the DuckDB staging database directly in any SQL IDE that supports DuckDB:
Database Location:
- Path:
./data/staging/sec.duckdb(from RoboSystems root directory)
Using DuckDB CLI:
# Connect directly to the staging database
duckdb ./data/staging/sec.duckdb

# Run SQL queries interactively
D> SELECT identifier, name, industry FROM Entity LIMIT 10;
D> .tables  # List all tables
D> .schema Entity  # Show table schema
Using SQL IDE Tools:
Any SQL IDE with DuckDB support can connect to the staging database for visual exploration and querying.
Example queries:
-- See all companies loaded
SELECT identifier, name, industry, ticker FROM Entity;

-- Check facts by year
SELECT
  strftime(CAST(p.instant_date AS DATE), '%Y') as year,
  COUNT(DISTINCT f.identifier) as fact_count
FROM Fact f
JOIN FACT_HAS_PERIOD fhp ON f.identifier = fhp.src
JOIN Period p ON fhp.dst = p.identifier
WHERE p.instant_date IS NOT NULL
GROUP BY year
ORDER BY year DESC;

-- Find largest revenue figures
SELECT
  e.name,
  f.numeric_value,
  p.instant_date
FROM Fact f
JOIN FACT_HAS_ELEMENT fhe ON f.identifier = fhe.src
JOIN Element el ON fhe.dst = el.identifier
JOIN FACT_HAS_PERIOD fhp ON f.identifier = fhp.src
JOIN Period p ON fhp.dst = p.identifier
JOIN REPORT_HAS_FACT rhf ON f.identifier = rhf.dst
JOIN ENTITY_HAS_REPORT ehr ON rhf.src = ehr.dst
JOIN Entity e ON ehr.src = e.identifier
WHERE el.name = 'Revenues'
ORDER BY f.numeric_value DESC
LIMIT 10;
Benefits of Direct SQL Access:
- Browse all staging tables
- Run SQL queries with full DuckDB features
- Export query results to CSV/JSON
- View table schemas and row counts
- Data quality checks before graph ingestion
Understanding the Data Model
The SEC graph has 14 node types and 22 relationship types organized around two core traversal patterns.
Node Types
Reporting nodes (the data):
- Entity - Companies (e.g., NVIDIA, Apple) with ticker, CIK, industry
- Report - SEC filings (10-K, 10-Q) with form type, filing date, fiscal period
- Fact - Individual financial data points with
numeric_valueandvalue - Element - XBRL metric definitions (us-gaap tags) with
canonical_concept(e.g., "revenue", "net_income") - Period - Time contexts (instant dates or duration start/end)
- Unit - Measurement units (USD, shares)
- Dimension - Dimensional qualifiers (segments, geographic breakdowns)
Structural nodes (how data is organized):
- Structure - XBRL presentation/calculation networks with
canonical_type(e.g., "income_statement", "balance_sheet") - Association - Parent-child element relationships within structures (e.g., Revenue rolls up into GrossProfit)
- Classification - Disclosure type labels on associations (e.g., AssetsRollUp, IncomeStatement, CashFlowStatement)
- FactSet - Logical groupings of facts by structure and statement type
Reference nodes (metadata):
- Label - Human-readable labels for XBRL elements
- Reference - Authoritative references (FASB codification)
- Taxonomy - Global XBRL taxonomy definitions
Key Traversal Patterns
Pattern 1: Fact-level queries (individual financial data points)
Entity (NVIDIA)
  ─[:ENTITY_HAS_REPORT]─▶ Report (10-K 2024)
    ─[:REPORT_HAS_FACT]─▶ Fact ($26.97B)
      ─[:FACT_HAS_ELEMENT]─▶ Element (us-gaap:Revenues, canonical_concept: "revenue")
      ─[:FACT_HAS_PERIOD]─▶ Period (2024-01-28)
      ─[:FACT_HAS_UNIT]─▶ Unit (USD)
      ─[:FACT_HAS_DIMENSION]─▶ Dimension (optional, for segment breakdowns)
Pattern 2: Statement-level queries (structured financial statements via FactSets)
Structure (canonical_type: "income_statement")
  ─[:STRUCTURE_HAS_FACT_SET]─▶ FactSet
    ─[:FACT_SET_CONTAINS_FACT]─▶ Fact ─[:FACT_HAS_ELEMENT]─▶ Element
                                  └─[:FACT_HAS_ENTITY]─▶ Entity (filter by ticker)
This is what financial-statement-analysis uses — a single hop from Structure through FactSet to get all facts for a statement type, filtered by company.
Pattern 3: Taxonomy structure (how elements relate to each other)
Structure
  ─[:STRUCTURE_HAS_ASSOCIATION]─▶ Association
    ─[:ASSOCIATION_HAS_FROM_ELEMENT]─▶ Element (parent, e.g., Assets)
    ─[:ASSOCIATION_HAS_TO_ELEMENT]─▶ Element (child, e.g., CurrentAssets)
    ─[:ASSOCIATION_HAS_CLASSIFICATION]─▶ Classification (type: "AssetsRollUp")
Enriched Properties
During processing, elements and structures are enriched with semantic metadata:
Element.canonical_concept— Standardized concept name (e.g., "revenue", "total_assets", "net_income"). Use this for cross-company comparisons instead of raw XBRL qnames.Structure.canonical_type— Statement classification ("income_statement", "balance_sheet", "cash_flow_statement", "equity_statement", "comprehensive_income")Classification.type— Disclosure mechanics label (e.g., "AssetsRollUp", "IncomeStatement", "LongTermDebtMaturities")
Common Tasks
Reset Database
If you need to start fresh:
# Reset database and clear all data
just sec-reset

# Reset and reload company
just sec-reset && just sec-load NVDA 2025
Load Multiple Companies
# First company with automatic setup
just demo-sec --ticker NVDA --year 2025

# Load additional companies (user already created)
just sec-load AMD 2025
just sec-load INTC 2025

# Verify all loaded
just sec-health v
Find Available Financial Metrics
Use the read-graph-cypher MCP tool, or query directly:
# Find most common us-gaap elements
just graph-query sec "MATCH (el:Element) WHERE el.qname STARTS WITH 'us-gaap:' RETURN el.qname, el.name LIMIT 20"
Common financial metrics (XBRL qname → canonical concept):
us-gaap:Revenues→revenueus-gaap:NetIncomeLoss→net_incomeus-gaap:Assets→total_assetsus-gaap:Liabilities→total_liabilitiesus-gaap:StockholdersEquity→stockholders_equityus-gaap:EarningsPerShareBasic→eps_basicus-gaap:OperatingIncomeLoss→operating_incomeus-gaap:CashAndCashEquivalentsAtCarryingValue→cash_and_equivalents
Query by Time Period
# Find all facts from a specific date
just graph-query sec "MATCH (f:Fact)-[:FACT_HAS_PERIOD]->(p:Period) WHERE p.instant_date = '2024-12-31' RETURN COUNT(f)"

# Find facts for a fiscal year
just graph-query sec "MATCH (f:Fact)-[:FACT_HAS_PERIOD]->(p:Period) WHERE p.instant_date >= '2023-01-01' AND p.instant_date < '2025-01-01' RETURN COUNT(f)"
Troubleshooting
Service Not Running
If you get connection errors:
# Check services are running
docker ps

# Restart if needed
just restart
Database Empty
If queries return no results:
# Verify data loaded
just sec-health

# If no data, reload
just sec-load NVDA 2025
Loading Failures
If loading fails:
# Check Dagster logs (pipeline orchestration)
just logs dagster-webserver

# Check API logs
just logs api

# Reset and try again
just sec-reset
just sec-load NVDA 2025
Next Steps
- Explore Preset Queries: Run
just demo-sec-queryto see 25 curated examples — 15 Cypher queries and 10 document searches - Visualize with G.V(): Use our favorite tool G.V() to explore graph relationships interactively
- Learn Cypher: Explore graph query patterns with Cypher Manual
- Validate Staging: Use DuckDB CLI or SQL IDEs to inspect staging tables before ingestion
- Build Analysis: Use MCP client in Claude for financial analysis with your auto-generated API key
- Create Reports: Build automated reporting with Python client
- Add More Data: Load additional companies with
just sec-load TICKER YEAR
Resources
- Dagster Pipeline: See
/robosystems/adapters/sec/pipeline/for pipeline implementation - SEC Adapters: See
/robosystems/adapters/sec/for SEC client and processors - Health Check:
just sec-health vfor diagnostic information - G.V(): https://gdotv.com/ - Recommended graph visualization tool for Ladybug
- Cypher Docs: Cypher Manual
- MCP Protocol: Model Context Protocol
- RoboSystems API: http://localhost:8000/docs (when running locally)
- SEC EDGAR: SEC Website
- DuckDB: Documentation - SQL database for staging
- Search SEC narratives: Search & AI Retrieval - Full-text and semantic search over filing text
- XBRL taxonomy: Taxonomy & Frameworks - The rs-gaap and fac frameworks behind the facts
- Query the graph: Querying the Analytical Graph - Ad-hoc Cypher over the SEC graph
- MCP & operators: AI Operators & MCP - The MCP retrieval surface
- Shared repositories: Shared Repositories - SEC as the
ladybug-sharedtier: plans, subscription, and access